|
by James Kezar IV Hayes-Bohanan, Ph.D. |
||||
|
|
|
|
|
|
|
|
Back to Rondônia Web |
|
||
Chapter
IV: Findings
In terms of the critical realism approach described in
Chapters I and III above, the results of this research project may be divided
conceptually into an intensive phase of direct observation and interviews
at the local scale in several cities of Rondônia and an extensive
phase of analysis of patterns at the state level. This chapter reports
results in these two phases. The first section presents findings based
on direct observations and progressive, rolling interviews during a three-month,
visit to Rondônia in 1996. These preliminary findings led to the
formulation of certain hypotheses, which are presented and tested in the
second section of this chapter .
The observations are divided into a sub-section for each of the municípios in which I spent significant time. In the case of Porto Velho, I have divided the observations into those related to the city of Porto Velho itself and those related to the rural areas of the município of Po rto Velho. The majority of the time I spent in Rondônia was spent in Porto Velho, the capital and largest city of Rondônia. It was in Porto Velho that I gathered data and documents related to Rondônia as a whole, interviewed both ordinary citizens and people knowledgeable about particular aspects of its development, and made contacts that were helpful in organizing my trips to other parts of the state.
I made two separate visits to the nearby município of Candeias do Jamari, spending the first in the town of Candeias itself and the second in the rural zone of Candeias. I spent a week traveling to the interior of Rondônia, dividing my time between Ouro Preto do Oeste, located on BR-364 in the center of the state, and Rolim de Moura, located thirty kilometers south of the main highway in the center-south portion of Rondônia.
The Brazilian city of Porto Velho is known to outsiders mainly as the gateway to Rondônia. If the city is mentioned in an article, it is likely to be only because the airport was closed by the smoke of burning rain forests as a writer was trying to get to the "real" story somewhere in Rondônias interior. Even within Brazil, this capital city of almost 250,000 -- the third largest in the Amazon region -- is b arely known. Scouring six months of Veja (Brazils major newsweekly) page-by-page may not reveal a single mention of Porto Velho. Sometimes Porto Velhenses themselves do not even seem to believe it is a real place. The fact that I had traveled to Brazil specifically to spend three months in their adopted city was sometimes met with disbelief and even a measure of annoyance that I had bypassed other regions of Brazil that my hosts were certain I would have found more interesting. Some informants would not understand initial questions, because they had not previously thought critically about the places they live, owing to a certain ambivalence about the urban places in Rondônia that is prevalent both among its citizens and among academic researchers and journalists. For this reason, the rolling interview technique sometimes involved returning to the same informant on several or many occasions.According to an interview with a geographer at SEMPLA, the municipal planning agency in Porto Velho and maps provided by the agency, the built-up urban area of Porto Velho grew four-fold between 1980 and 1988, a period during which the population doubled (Field notes, August 6, 1996; SEMPLA, n.d.). The urban area now measures approx imately 100 square kilometers, and encompasses contrasting areas in the central business district, the rapidly growing fringe, and what are now well-established neighborhoods in between. The following sections describe observations and interviews in each of several parts of the city, beginning with the neighborhood in which I lived.
Cidade do Lobo is located on the extreme southern edge of the city and was settled in 1984. The name, which literally means "City of the Wolf" derives from the name of landowner João Lobo. The settlement was in some ways a spontaneous settlement, but it was also the result of a complicated arrangement in which Lobo offered 1200 lots for sale at a symbolic price of one cruzado to people who had invaded other land holdings which he hoped to develop (Yangopoulos 1989). Much of Lobos land had been in agricultural use at the time the settlement was created.
Initially, conditions were rather p oor, with self-built housing and little infrastructure (Yangopoulos 1989). By the time of my fieldwork, the neighborhood was in transition, both because of in situ improvements in housing and the expansion of infrastructure, and because of the influx of relatively affluent migrants. On several occasions, I visited the home of a university professor who owned a house and a double lot in Cidade do Lobo. In many ways, the household resembled my temporary home in Odacir Soares, although the lot was large r and contained more fruit trees (field notes, June 2, 1996).
The property comprised two lots, one of which the professor had purchased in 1991, and the other of which he purchased soon after that. Both lots were purchased from somebody who had invaded it in 1985, when the land was still in rain forest. The professor had bought the land without clear title, and believed that technically the land still belonged to the state. Because it had been continuously inhabited for over a decade, however, he wa s unconcerned about the legal status of the title (field notes, June 23, 1996).
Land invasions have been renewed in nearby Cidade do Lobo II, a short walk from my informants home in Cidade do Lobo. The new settlement is unauthorized but well organized. New residents would not have city services or title to the land at first, but by carefully demarcating the area they were invading into well-organized lots, they increased the likelihood that the city government would authorize the settlement and pro vide services after the fact. The process of land invasion in Cidade Lobo II is broadly similar to the process in other Latin American cities, but it is different in some key respects.
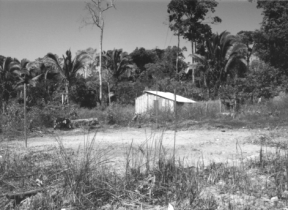
First, Cidade do Lobo is an an area on the periphery of Porto Velho adjacent to standing rain forest. For this reason, spontaneous settlement must in some cases be preceded by a substantial clearing effort, perhaps involving the cooperation of many people, and certainly feasible in the space of a day or two. Cidade do Lobo is surrounded by both standing rain forest and land that has already been cleared for agricultural and subsequent ranching use. In some cases, parcels obviously have been cleared specifically for settlement (Photograph 4), but in other cases it is difficult to tell whether the land is being claimed by those who cleared it or whether settlement is opportunistic (field notes, June 23, 1996). The distinction is important because it is an indication of whether expansion of urban settlement is at the expen se of standing rain forest.
Although migration to urban areas began as a process of stepwise migration from rural areas of the state (Yangopoulos 1989), by 1996 the mix of residents in Cidade do Lobo did not reflect this earlier pattern. My informant in Cidade do Lobo indicated that most of the residents now come from other states. Most of them work in the informal sector, although some have regular jobs (field notes, June 23, 1996).
On my final visit to Cidade do Lobo, my informant related an explanation of the origin of the settlement somewhat at odds with the history provided by the British students who had conducted fieldwork in the neighborhood previously (Yanopoulos 1989). He indicated that p art of the land had been given by the government to a group of 200 Japanese families, who attempted to farm it. The farm was unsuccessful, but the land they cleared was invaded by the Cidade do Lobo settlers (field notes, July 14, 1996).
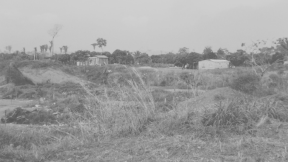
The eastern side of the city of Porto Velho is an extensive area that includes the most recent expansion of housing (SEMPLA, n.d.) My exploration of the ar ea began at the home of an entrepreneur and a friend of my host in Porto Velho; after a weekend visit to his home, we returned for a tour of about twelve new neighborhoods on the eastern periphery of the city.One such neighborhood is being developed in an abandoned clay mine on the edge of town (Photograph 5). My informant had purchased a plot there as an investment, paying US$ 120 for a corner lot measuring ten by thirty meters. An adjacent lot was selling for only US$ 80. The land is literally a hole in the ground, but it is located next to one of the many private employee associations (country clubs) on the former edge of the city which may make it a valuable investment. The same informant took us to visit a small farm comprising only one hectare on the edge of the city, which he hopes to add to his small portfolio of speculative peri-urban land holdings (field notes, August 7, 1996).
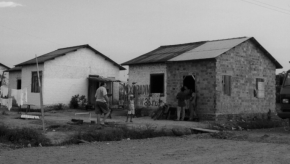
In some neighborhoods the municipal government has become directly involved in housing at a very early stage. At least two neighborhoods of single-family dwellings have been built as public housing in an effort to keep ahead of the demand for housing and infrastructure. These neighborhoods comprise long rows of houses, each on its own lot and each smaller than a typical self-built house (Photograph 6). The neighborhoods are known as Pombal (D ovecote) I & II because of the tiny size of the houses and the minimal provision of infrastructure. Because the houses are simple and the lots are relatively big, the program provides a way for families to obtain basic housing and then make in situ improvements.
The first of these visits was to a ranch owned by the sister and brother-in-law of one of my informants in Porto Velho. On the way to the ranch, located about 25 kilometers from BR-364 along one of the unpaved linhas (roads or, literally, lines) that were built as part of the INCRA settlement programs described in Chapter II above, I observed a number of abandoned properties, on which farm buildings and homes were being overtake n by vegetation. The forest had not been cleared to the horizon, but neither did any remain in close proximity to the road, confirming the importance of roads as an agent in forest clearing. The soil supported secondary growth to an unexpected degree, although apparently the soils would not support any economically viable crops or forage (field notes, June 9, 1996).
This ranch was owned by an urban family, who maintain it as a working ranch, a convenient recreational retreat, and a speculative inves tment. Both parents in the family work as accountants in the city of Porto Velho. About forty people attended the weekend festivities, most of them residents of the city of Porto Velho. The owners employ another family as caretakers, who live in a very modest house on the property. The main recent improvement was a satellite dish and television, purchased at considerable expense, apparently for the weekend enjoyment of the owners.
On a tour of the property, I learned a lot about the ambivalence of o wners of ranches like these toward the environmental controversy that surrounds their activities. After driving to the back of the property where a large tract of rain forest had been cleared, the owner of the land confessed that "the ecological crime here is mine," and indicated that he was attempting to reforest some areas of the property. Indeed, he had restored the watershed surrounding a small spring on the property.
A fellow rancher who was visiting did not see ranching activities as environmentally problematic, though. He was from Ariquemes, where he owned a bigger ranch with more cattle and also coffee and other crops. He was more emphatic than the owner in explaining and defending what was happening on the ranches. He cited the destruction of North American forests and pointed out that the owner of the ranch we were visiting was only burning the forest once. He was not destroying it, the visitor said, but rather improving it, because cattle cannot survive on the virgin forest (field notes, June 9, 1996).
Much of the ranch we were visiting, which encompasses an area of 2,000 hectares, had been cleared by the previous owner, but some of the clearings I visited had been burned only a year before. The current owner reported purchasing the entire property from a single seller. Given its large size, that seller could not have been an original INCRA grantee. Rather, it appears that the property had followed a trajectory typical of many ranches in the region, as described in Chapter I I above. The land was consolidated from the holdings of approximately twenty families, all of whom had now abandoned their farms, and many of whom had probably migrated to urban places in Rondônia.
A smaller farm that I visited had a very different history. Located about 40 kilometers to the west of Porto Velho, this ranch is still inhabited by the family who was granted the land by INCRA in 1972. I was taken there by the same informant who had taken me to visit the large ranch. The small farm belongs to the family of one of his coworkers in Porto Velho, a woman who now works in an office of a state agency in the capital. She was born in Sergipe, in the Northeast of Brazil, but was raised on the farm granted by INCRA, the oldest of eight children, and the only one not born in Rondônia.
Unlike the families who had been forced to abandon the farms that were consolidated into the large ranch I visited, this family had continously farmed their land since the original grant of 72 hectar es by INCRA in 1972. Although the household income was supplemented by the adult daughter working in the city, the land remained in productive use after 25 years of occupation. The mixed farm includes a herd of 200 cattle, an orchard of 600 cupuaçu (regional fruit) trees, and several ponds managed for aquaculture. In 1994 the family had spent US$ 3,500 to obtain an electrical connection, and now had television, a refrigerator, and other conveniences. Clearly the household income was being supplemente d by the daughter working in the capital (field notes, June 16, 1996).
The attitude of this long-term resident farmer toward conservation contrasted with the views expressed the week before by the urban ranch owners. A requirement of the INCRA land grants had been that fifty percent of each parcel would remain uncleared. The farm I visited did not have any remaining forest, although a few small stands of trees were present. We visited uncleared forest on an adjacent ranch, however, where the farmer showed me a particular tree that had been used by indigenous people in the area. His tone suggested that the indigenous were ancient, but it was apparent that they had been active in the area shortly before the INCRA program pushed them out of their territory.
Although no standing forest remained on his farm, after visiting the adjacent forest, the farmer commented on the importance of its preservation, so that a balance among forest, cattle, and tree crops could be maintained. His tone was more ear nest and less defensive than those of the ranchers mentioned above. The difference, perhaps, is one of the level of awareness of how those directly involved in the clearing of the rain forest are viewed in Northern media (field notes, June 16, 1996). That is, the men who were living in the cities and running their ranches as businesses were much more aware both of how such activities have been portrayed in the North and of the degree to which the North has been hypocritical in its criticism. This family far mer had some notion that the North was concerned about deforestation, but did not seem to be accutely aware of the discourse.
Both the large ranch and the small farm that I visited were connected in important ways to the city of Porto Velho itself. In the first case, the business decisions of an urban family had important implications for the future of the property. In the second case, the family was able to maintain a mixed farm in part because of the subsidy provided by the urban employment of one of its members. The recent acquisition of satellite television on both farms is symbolic of the ways in which increased connection between the city and the countryside implies increased connection between that countryside and the rest of the world.
Candeias do Jamari (usually known simply as Candeias) is a small, recently-settled town located about twenty-five kilometers east of Porto Velho on BR-364. I first noticed the town on my way to the hydroelectric plant nearby, and decided to return to learn more about it. Although it is the seat of a separate município, it is very closely connected to Porto Velho, and easily accessible by city buses, which leave for Candeias about twice per hour.Candeias is located near the bridge where BR-364 crosses the Rio Candeias. The town is on a bluff over a great bend in the river, and is oriented along the highw ay itself. Buildings in the town are of both wood and other materials, and appear to have been built recently, and most of the roads are newly paved. Young employees in two shops that I visited indicated that they had lived in the town for only a few years, and had migrated directly from cities in other regions of Brazil. Even though the entire município has only 5,000 residents, the town has its own legislative body. It was formed in 1991, its growth from a small fishing village of about ten homes f acilitated mainly by the tax-collection station operated by the state on the highway at the river crossing (field notes, June 26, 1996) to collect tariffs from interstate truck traffic.
Contacts in Porto Velho led me to an artist who lives on the Rio Candeias a few kilometers upstream of the town. He and his wife live on 180 hectares granted to them by INCRA in 1975. The land remains forested, and is located on a 30-meter bluff overlooking a great loop of the Rio Candeais, about 75 minutes by motor boat from town. Although they live far from town, Anká was able to share some insights about Candeias. The economy of the town apparently depends upon state and municipal employment and the provision of related services, such as a new truck stop and bus station. Candeias also appears to serve as bedroom community of Porto Velho, with many residents commuting to the capital for employment on at least an occasional basis (field notes, July 30, 1996).
It was in Candeias that I first began to que stion whether the boom-town model of frontier urbanization in Rondônia is still applicable in the second half of the 1990s. I had no doubt that Candeias had emerged as quickly as the boom towns described almost a decade earlier by Godfrey (1990), but it did not appear to have the ephemeral qualities described for those towns that had rapidly grown from mining camps. Candeias appeared to be a new kind of emerging town, one that was rapidly developing an infrastructure and, more importantly, links to ot her urban places, both within the region and beyond. My thinking about Candeias contributed to the development of the hypothesis on the complexity of Rondônias urban network that I describe below.
Because of contacts made in Porto Velho, I chose to
spend several days in the city of Ouro Preto dOeste, which translates
literally as "Black Gold of the West." It is a city of 25,000 located directly
on BR-364 near the center of the state. During my visit I was able to explore
many parts of it on foot, interview local residents, and make some basic
observations about the timber industry.
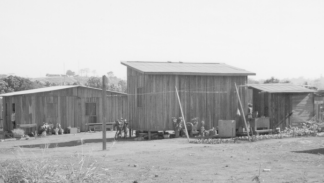
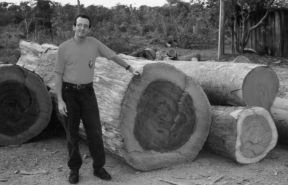
During an informal interview in Porto Velho prior to my visit, a state environmental official had indicated that timber consumption within Rondônia comprised a very minor part - no more than ten percent - of the demand for timber harvested in the state. O bservations in Ouro Preto, a major wood-processing center, provided further evidence of this claim. In Ouro Preto, most of the houses are constructed of wood (Photograph 7), but the scale of the timber operations appears to be vastly out of proportion to that which would be required to sustain this construction. A number of saw mills are located on the east side of the highway near the center of the city. The yards of these mills are filled with enormous logs, and trucks are seen leaving the city toward th e south, often able to contain only a few of these logs (July 22, 1996).
Photograph 7: Wood-plank houses, Ouro Preto do Oeste
The recent frontier h istory of Ouro Preto as a city on the frontier is manifested in a number of ways in the cultural landscape of the city. A cathedral built as late as 1995 included a bas-relief depicting pioneer themes, which are also featured on public statuary. Even the name of the local seat of government is telling: Pioneer Palace (field notes, July 22, 1996). The cultural landscape also reflects a pattern of migration influenced by its relative proximity to the South of Brazil. The names of some bars and other businesse s in Ouro Preto reflect ties to Pará and other southern states. Some of the houses are in a German style that suggests the European roots of some of the migrants who have come from the South of Brazil. The population of Porto Velho, composed of migrants from both the Northeast and the South, includes an eclectic racial variety typical of the country as a whole. The majority of the population in Ouro Preto has come from the South of Brazil, however, and therefore many more of its residents are of rela tively recent Western European origin.
The former municipal airport in Ouro Preto is the site of perhaps the most unusual residential settlement I encountered during my fieldwork. Even some of its earliest residents are unaware of its unusual history. I interviewed several long-time residents who could not recall the origin of the community, but they were able to lead me to a local business owner who had lived in the neighborhood since its inception. The municipal airport in Ouro Preto had been loca ted next to a large expanse of rain forest. It ceased operation at the beginning of the dry season in 1985 and was abandoned. In August, at the end of the dry season, the rain forest along the air strip was burned and massive trees were removed. The land was never used for agriculture, but rather was cleared specifically for urban, residential use. The land invasion was spatially well-organized, and now a large neighborhood is oriented on a very regular grid oriented along an extremely long and straight bou levard that was the original landing strip (Photograph 8). The axis of that strip is now one of the major arteries of the city (field notes, July 23, 1996).
Beyond the important observations of its cultural landscape, my experience in Ouro Preto do Oeste, combined with my experience in Rolim de Moura, contributed to the development of the hypothesis regarding timber production discussed later in this chapter. My observations at the edges of the city, combined with my observations at the edges of Por to Velho, led to the hypothesis regarding urban sprawl, also described later in this chapter.
Photograph 8: Airport Garden Neighborhood, Ouro Preto do Oeste
 I became interested in Rolim de Moura, a remote town in
south-central Rondônia, both through some reading about the frontier
experience there and through my contact with an English professor in Porto
Velho who had once lived there. She had migrated from São Paulo
to Rolim de Moura in the late 1980s to teach English at a new branch of
UNIR, the Federal University of Rondônia (field notes, June 30, 1996).
Rolim de Moura was first settled as a NUAR (urban center for the support
of rural settlements) related to an INCRA grant of 3, 000 lots in 1975
(Batista 1989, 15). Even at its inception, the town was built on a grand
scale. The main boulevard is 100 meters wide, and the secondary arteries
are 30 meters wide. Since none of these streets was paved in the early
years of the settlement, a red dust obscured visibility in the town during
the dry season (Ellis 1988).
I became interested in Rolim de Moura, a remote town in
south-central Rondônia, both through some reading about the frontier
experience there and through my contact with an English professor in Porto
Velho who had once lived there. She had migrated from São Paulo
to Rolim de Moura in the late 1980s to teach English at a new branch of
UNIR, the Federal University of Rondônia (field notes, June 30, 1996).
Rolim de Moura was first settled as a NUAR (urban center for the support
of rural settlements) related to an INCRA grant of 3, 000 lots in 1975
(Batista 1989, 15). Even at its inception, the town was built on a grand
scale. The main boulevard is 100 meters wide, and the secondary arteries
are 30 meters wide. Since none of these streets was paved in the early
years of the settlement, a red dust obscured visibility in the town during
the dry season (Ellis 1988).
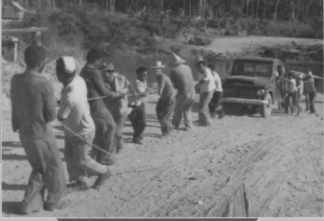
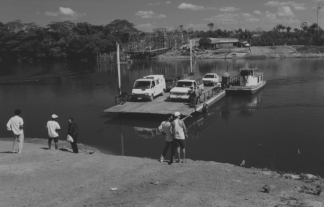
When I visited Rolim de Moura, I met first with former colleagues of the English professor who had once worked there. Although a paved road now links Rolim de Moura to Pimenta Bueno, the approach from the north is still rather arduous. It is far easier, however, than it had been in the 1970s and 1980s. The original ferry apparently was not motor-powered, and the crossing was arduous, particularly during the wet season (Photograph 9). By the time of my visit, a motor-powered ferry was in operation, and a new bridge was near completion, implying greater connectivity for Rolim de Moura in the future (Photograph 10; field notes, July 24, 1996).
Photograph 9: Ferry Crossing to Rolim de Moura, 1976
During my first evening in Rolim de Moura, I met three men in the lobby of my small hotel, who gave me some insight into how the elites of the region view its problem s. These elites offered an explanation of the aftermath of rural colonization that differs strongly from that offered in the literature reviewed in Chapter II above. One of the men had migrated as a child in 1972 when his family received one of the original land grants. The family has since prospered, he believes, because they subsequently divorced themselves from government programs. The government programs failed, not because the climate and soils were not suitable for settlement, but because the landless peasants who received the land grants did not have the initiative or sophistication to succeed. He offered as proof the fact that they would frequently sell failed farms, making themselves landless again (field notes, July 24, 1996).
My host from the university introduced me to João Batista, the author whose work had originally piqued my interest in the city of Rolim de Moura. I also interviewed them about the economy of the area. Both of my informants recognized a sharp decline in the popul ation and economy of the município, which they ascribed to political failures. They pointed out that of the 180 saw mills once present in the town, only a handful now operate. The soils were better, too, early in the colonization effort. The professor, who lives on a farm outside of town, reports that the rice grew twice as tall in the early years as it does now (field notes, July 25, 1996). Again, explanations for these declines common in the literature are not accepted by local elites. At the time of my visit, 87 percent of the município had been deforested, so the decline in lumber yards should not have been surprising (EMATER-RO, 1996). The decline in crop yields is inevitable, given the rapid loss of soil fertility following the first few seasons under cultivation following a slash-and-burn clearing.
The improvements in transportation in and out of Rolim de Moura suggest that while it remains fairly isolated and difficult to reach, its connections to other urban centers are growing. Not only have connections to the BR-364 been improved, but Rolim de Moura now also serves as a gateway to the small towns Santa Luzia dOeste, Alta Floresta do Oeste, and other towns to the south and west of Rolim de Moura.
Friends in Porto Velho suggested that I seek out Solimar Bergamin, the owner of a music shop in Rolim de Moura, the only person I met there who speaks any English. He had come to Rolim de Moura as an accountant for various timber-related enterprises, but started the music shop a nd a T-shirt printing business when he saw the timber industry declining. In this way, his experience is an exemplar of the economic diversification that I describe in more detail below. I interviewed him about the city and the timber industry while he took me on a driving tour of the area.
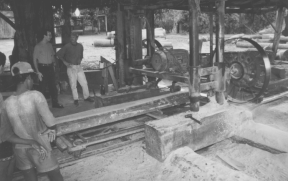
Our tour included a sawmill owned by his brother (Photograph
11), where I learned that a single, 2.5 meter section of a large tree can
supply all of the wood needed to build a modest house. We also visited
a plyw ood manufacturing plant (Photograph 12), which my host had not visited
previously. Unlike the sawmills, this business was expanding, and already
employed about 50 people at the time of my visit. One reason for the expansion
of the plywood industry is that serengeira and mahogany, which are
preferred for higher-value processing, have been seriously depleted in
the region. Other species of wood, suitable for plywood, are still relatively
abundant. The sawmills themselves now rely on wood concessions fr om indigenous
groups for the remaining supply of the higher-value species (field notes,
July 26, 1996).
Photograph
11: Sawmill in Rolim de Moura
Observations along BR-364
In a ro om adjacent to the control center for power distribution from the Samuel Dam, a miniature museum has been created, describing the efforts to rescue animals that had been threatened by the inundation of rain forest land behind the dam. It is not clear who the intended audience for the museum is, given that access to the dam itself is very closely regulated. In addition to photographs and narrative of the rescue operations, many of the animals themselves have been preserved and are kept in the museum. A room overlooking the control panels is filled with hundreds of stuffed birds, monkeys, sloths, and other animals. This rather grim memorial raises at least some doubt as to the effectiveness of the rescue operations (field notes, June 15, 1996).
During my visit to the hydroelectric plant, it was evident that a significant area of rain forest had been inundated by the reservoir. It was only during subsequent travel many kilometers to the south of the dam that I became aware of the scale of the inundation (field notes, July 21, 1996). The impoundment created by the dam plant is about fifty kilometers long, with an average width of approximately ten kilometers and a maximum width of greater than twenty kilometers. The inundated area, therefore, is approximately 600 square kilometers. Both near the dam and at the margins of the reservoir, standing trees remain in the inundated area, indicating that a significant amount of rain forest was lost as a result of the reservoirs construction, and that salvage operat ions, if any, were not adequate.
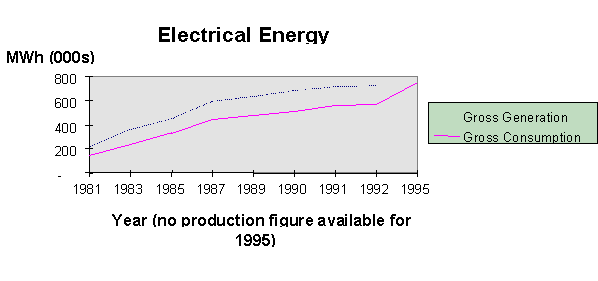
The manager on duty the day of my tour indicated that projected demand is sufficient to justify a plant similar to Uhe Samuel in the center of the state, and that some plans had already been made to construct such a plant. He did not expect, however, that an additional plant would actually be built for at least fifteen more years. Further analysis of trends in energy production is presented later in this chapter.
Informants in Porto Velho provided more insigh ts into the electrical industry. One fairly typical household in which two small air conditioners are used sparingly pays about US$ 100 per month for electricity. Even though the marginal costs of hydroelectric production should be low, the cost to the end user is high for two reasons. First, ELETRONORTE has high overhead attributed to rather lavish expenditures on its employees (for whom an entire subdivision has been built in Porto Velho) and perhaps also to corruption. Two of the seven turbines originall y planned for the Samuel Dam were never installed, apparently because part of the money needed to pay for them had disappeared. Second, many electric customers reverse the direction of their electric meters each evening, so that billable net usage appears to be negligible, increasing fees for those who do not tamper with the meters.
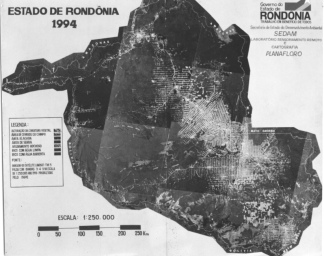
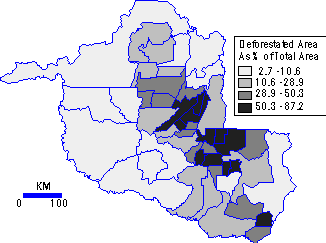
This section presents results of extensive research activities related to the relationship between urbanization and deforestation in Rondônia. It begins with an overview of the spatial organization of deforestation in Rondônia, followed by a presentation of several hypotheses about the relationship between urbanization and deforestation, which were developed on the basis of the observations presented in the first section of this chapter. This section presents these hypotheses -- which themselves are an intermediate result of the research project -- and the results of hypothesis testing. These comprise the extensive phase of the research project, as described in Chapter III above. This section also presents new data on electric power generation and state economic development plans. These are extensive in spatial coverage, although they do not involve formal hypothesis testing. Estimates of deforestation in each município have been prepared by SEDAM, Rondônias state environmental agency, and were made available as part of the states 1995 yearbook (EMATER-RO 1996). A total of four million hectares, representing seventeen percent of the total land area of the state, was deforested between 1978 and 1993. Rates varied widely, from a low of 2.7 in Guajara-Mirim to a high of 87.2 percent in Rolim de Moura (Table 7). This pattern corresponds well to the pattern exhibited in a 1993 composite LANDSAT image of the state (Figure 5). The most heavily deforested areas are found along the BR-364 corridor, where most of Rondônias older and larger cities are also found (compare Figure 1 and Figure 6). Among these older municípios, such as Ariquemes and Cacoal, clearing on the order of 40 to 50 percent is common.| Name |
|
|
|
| Alta Floresta d'Oeste |
722,424
|
76,567
|
10.6
|
| Alto Alegre dos Parecis |
328,378
|
64, 504
|
19.6
|
| Alto Paraiso |
274,294
|
51,765
|
18.9
|
| Alvorada d'Oeste |
297,336
|
71,075
|
23.9
|
| Ariquemes |
455,826
|
180,639
|
39.6
|
| Cabixi |
164,478
|
69,616
|
42.3
|
| Cacaulandia |
179,720
|
62,440
|
34.7
|
| Cacoal |
371,002
|
186,515
|
50.3
|
| Campo Novo de Rondônia |
550,283
|
44,223
|
8.0
|
| Candeias do Jamari |
658,896
|
102,890
|
15.6
|
| Castanheiras |
93,387
|
43,541
|
46.6
|
| Cerejeiras |
812,180
|
123,653
|
15.2
|
| Colorado do Oeste |
166,623
|
90,482
|
54.3
|
| Corumbiara |
436,588
|
218,084
|
50.0
|
| Cost a Marques |
1,464,131
|
42,972
|
2.9
|
| Cujubim |
391,083
|
28,174
|
7.2
|
| Espigao d'Oeste |
462,555
|
133,527
|
28.9
|
| Gov Jorge Teixeira |
480,235
|
69,597
|
14.5
|
| Guajara-Mirim |
2,422,570
|
64,538
|
2.7
|
| Jamari |
407,067
|
47,487
|
11.7
|
| Jaru |
337,148
|
180,035
|
53.4
|
| Ji-Paraná |
628,992
|
179,514
|
28.5
|
| Machadinho d'Oeste |
813,362
|
61,935
|
7.6
|
| Ministro Andreazza |
67,456
|
39,356
|
58.3
|
| Mirante da Serra |
120,037
|
31,522
|
26.3
|
| Monte Negro |
173,635
|
56,424
|
32.5
|
| Nova Brasilandia d'Oeste |
113,808
|
44,912
|
39.5
|
| Nova Mamore |
997,696
|
61,464
|
6.2
|
| Nova Uniao |
58,893
|
40,358
|
68.5
|
| Novo Horizonte do Oeste |
76,891
|
39,008
|
50.7
|
| Ouro P reto do Oeste |
220,443
|
120,730
|
54.8
|
| Parecis |
381,138
|
23,029
|
6.0
|
| Pimenta Bueno |
808,058
|
217,395
|
26.9
|
| Porto Velho |
3,522,718
|
245,207
|
7.0
|
| Presidente Medici |
188,296
|
103,821
|
55.1
|
| Primavera de Rondônia |
46,369
|
40,107
|
86.5
|
| Rio Crespo |
181,428
|
48,685
|
26.8
|
| Rolim de Moura |
138,157
|
120,426
|
87.2
|
| Santa Luzia d'Oeste |
145,302
|
71,375
|
49.1
|
| Sao Felipe d'Oeste |
80,389
|
41,698
|
51.9
|
| Sao Miguel do Guaporé |
765,271
|
63,432
|
8.3
|
| Seringueiras |
470,169
|
40,320
|
8.6
|
| Teixeiropolis |
54,759
|
22,495
|
41.1
|
| Theobroma |
217,863
|
90,489
|
41.5
|
| Urupa |
82,201
|
40,360
|
49.1
|
| Vale do Anari |
234,154
|
23,316
|
10.0
|
| Vale do Paraiso |
100,748
|
72,971
|
72.4
|
| Vilhena |
1,321,188
|
113,114
|
8 .6
|
| State Total |
17.1
|
Source: EMATER-RO 1996
Clearly, then, land conversion for urban use is a mechanism linking urban growth and deforestation, but the mechanism is not always present, as some neighborhoods eme rge without the need for new clearing. More importantly, the observation that the mechanism exists is useful, but it would be more useful to have an idea of the magnitude of its importance. That is, is urban sprawl a significant cause of deforestation in Rondônia? This may be stated more formally as
H0: The clearing of land for urban expansion is not significantly related to overall clearing of land in Rondônia.
To test this hypothesis, simple correlation is used to test for a relationship between the amount of urban land and total deforestation at the município level.
I arranged to examine maps and images in the offices of the State Secratariat for Environmental Development (SEDAM), in order to estimate the extent of urban sprawl in each município in Rondônia. Large-scale (1:250,000) color composites of LANDSAT Thematic Mapper Images were available for a variety of years between 1988 and 1995. Highway maps were available to aid in the identification of towns appearing on the images. Images were available for twenty-one of Rondônias fifty-two município seats, representing about 85 percent of the total urban population. Because of the high spectral reflectance of roads and buildings in the visible portion of the spectrum, each urban place exhibits both distinct color and distinct texture on the composite or the image, facilitating the calculation of the size of the urban area.
Table 8 presents the areal extent of each município seat (urban place) and of each município as a whole. To facilitate comparison, the latest available areal extent of each município is used. Urban places occupy an average of 0.16 percent of each município, ranging from a low of 0.01 percent in Vila Nova Mamoré to a high of 1.08 percent in Rolim de Moura. Vila Nova Mamoré is among the smallest of Rondônias cities in population, while Rolim de Moura is very large for its population size, prin cipally because of the unusual design of its street grid described in the section on Rolim de Moura above. The largest city in both population and area is Porto Velho, comprising 99 square kilometers, but it occupies only 0.28 percent of its município, which also has the largest surface area. The total areal extent of urban places was extrapolated on a per-capita basis from the 85 percent of the population in the sample. Because a significant positive correlation (p = 0.0000) was found (b = 0.0269, r2 = 0.5364) between the area occupied by urban sprawl and the extent of deforestation in each município, the null hypothesis is rejected. Because the independent variable is the area of each urban place, rather than its population, this finding relates most directly to the question of the impacts urban sprawl itself, rather than to secondary relationships discussed elsewhere in this chapter. The implications of this finding are discussed further in Chapter V below.
|
|
|
|||||
| City |
|
|
|
|
|
|
|
|
6.0
|
8,598
|
0.07%
|
9,379
|
31,980
|
29.3%
|
|
|
2.2
|
2,982
|
0.07%
|
7,580
|
21,045
|
36.0%
|
|
|
22.0
|
4,704
|
0.47%
|
45,283
|
83,684
|
54.1%
|
|
|
19.3
|
3,809
|
0.51%
|
44,091
|
78,934
|
55.9%
|
|
|
2.8
|
6,868
|
0.04%
|
N/A
|
N/A
|
|
|
|
7.5
|
10,751
|
0.07%
|
14,737
|
21,608
|
68.2%
|
|
|
12.0
|
25,214
|
0.05%
|
27,406
|
32,583
|
84.1%
|
|
|
9.8
|
2,910
|
0.34%
|
27,675
|
63,535
|
43.6%
|
|
|
27.0
|
6,899
|
0.39%
|
75,414
|
97,799
|
77.1%
|
|
|
3.8
|
11,716
|
0.03%
|
4,891
|
16,765
|
29.2%
|
|
|
1.0
|
1,254
|
0.08%
|
N/A
|
N/A
|
|
|
|
1.2
|
10,113
|
0.01%
|
3,724
|
7,248
|
51.4%
|
|
|
3.6
|
1,160
|
0.31%
|
5,031
|
15,798
|
31.8%
|
|
|
0.3
|
834
|
0.03%
|
N/A
|
N/A
|
|
|
|
4.0
|
3,238
|
0.12%
|
23,586
|
83,857
|
28.1%
|
|
|
99.0
|
35,929
|
0.28%
|
229,788
|
287,534
|
79.9%
|
|
|
3.0
|
1,694
|
0.18%
|
10,803
|
30,064
|
35.9%
|
|
|
16.0
|
1,487
|
1.08%
|
28,272
|
59,751
|
47.3%
|
|
|
1.1
|
1,188
|
0.09%
|
4,287
|
< P ALIGN="RIGHT">12,328 |
34.8%
|
|
|
2.2
|
7,815
|
0.03%
|
2,218
|
19,458
|
11.4%
|
|
|
0.8
|
850
|
0.09%
|
N/A
|
N/A
|
|
|
|
244
|
150,013
|
0.16%
|
564,165
|
963,971
|
58.5%
|
|
|
287*
|
659,327
|
1,132,692
|
58.2%
|
||
*Note: Total urban land area for the state of Rondônia is estimated.
| Município |
|
|
|
|
|
|
|
|
| Alta Floresta d'Oeste |
300
|
3,750
|
25,289
|
1,000
|
7,920
|
429
|
0
|
4,190
|
| Alto Paraiso |
0
|
4,080
|
280
|
420
|
3,984
|
180
|
2,003
|
10,828
|
| Alvorada d'Oes te |
3,000
|
1,500
|
3,300
|
350
|
5,000
|
350
|
0
|
2,530
|
| Ariquemes |
0
|
3,250
|
1,143
|
200
|
1,990
|
940
|
6,300
|
3,000
|
| Cabixi |
50
|
4,000
|
3,300
|
540
|
5,800
|
260
|
25
|
250
|
| Cacaieiros / Novo Horizonte |
1,650
|
3,360
|
3,094
|
840
|
3,528
|
80
|
25
|
3,225
|
| Cacaulandia |
1 00
|
1,500
|
700
|
500
|
4,000
|
1,083
|
6,008
|
3,500
|
| Cacoal |
2,496
|
9,517
|
11,283
|
1,410
|
16,038
|
1,325
|
1,772
|
20,797
|
| Campo Novo de Rondônia |
0
|
550
|
70
|
659
|
637
|
208
|
9
|
42
|
| Candeias do Jamari |
0
|
2,000
|
125
|
3,000
|
900
|
346
|
15
|
300
|
| Castanheiras |
70
|
1,472
|
1,174
|
400
|
2,016
|
32
|
0
|
1,228
|
| Cerejeiras |
400
|
4,400
|
2,196
|
594
|
5,400
|
240
|
34
|
182
|
| Colorado do Oeste |
0
|
8,250
|
17,800
|
600
|
16,200
|
546
|
306
|
163
|
| Corumbiara |
638
|
4,820
|
9,480
|
450
|
9,480
|
200
|
472
|
1,000
|
| Costa Marques |
150
|
2,200
|
2,400
|
635
|
2,200
|
200
|
0
|
700
|
| Espigao d'Oeste |
500
|
900
|
1,600
|
475
|
3,787
|
175
|
0
|
1,550
|
| Gov. Jorge Teixeira |
800
|
3,250
|
2,760
|
720
|
4,720
|
2,060
|
2,115
|
2,530
|
| Guajara-Mirim |
0
|
1,150
|
600
|
1,500
|
1,260
|
850
|
0
|
15
|
| Jamari |
0
|
1,310
|
25
|
643
|
140
|
70
|
10
|
50
|
| Jaru |
1,300
|
11,410
|
6,558
|
880
|
11,690
|
3,600
|
6,000
|
3,625
|
| Ji-Paraná |
2,130
|
7,000
|
6,000
|
2,880
|
7,700
|
1,010
|
1,062
|
2,366
|
| Machadino d'Oeste |
80
|
5,000
|
1,500
|
3,800
|
3,640
|
980
|
1,200
|
6,200
|
| Ministro Andreazza |
372
|
2,264
|
3,573
|
470
|
5,758
|
375
|
345
|
4,990
|
| Mirante da Serra |
86
|
3,480
|
5,220
|
525
|
3,372
|
1,800
|
460
|
3,375
|
| Monte Negro |
0
|
3,900
|
1,620
|
800
|
5,950
|
1,177
|
670
|
6,250
|
| Nov a Brasilandia d'Oeste |
600
|
4,900
|
9,800
|
200
|
9,000
|
56
|
20
|
5,760
|
| Ouro Preto do Oeste |
1,122
|
10,535
|
9,250
|
1,960
|
12,557
|
6,720
|
3,906
|
6,643
|
| Pimenta Bueno |
2,748
|
4,657
|
6,320
|
800
|
7,968
|
320
|
22
|
4,248
|
| Porto Velho |
0
|
1,190
|
137
|
3,064
|
638
|
750
|
27
|
126
|
| Presidente Medici |
2,500
|
6,500
|
3,500
|
850
|
7,500
|
500
|
0
|
3 ,200
|
| Rio Crespo |
0
|
3,949
|
348
|
1,240
|
1,237
|
726
|
713
|
5,699
|
| Rolim de Moura |
1,360
|
5,376
|
3,200
|
1,400
|
7,056
|
112
|
0
|
5,376
|
| Santa Luzia d'Oeste |
540
|
2,700
|
9,7 98
|
650
|
6,462
|
200
|
27
|
3,200
|
| Sao Miguel do Guapore |
968
|
6,650
|
2,400
|
200
|
4,000
|
40
|
0
|
4,000
|
| Seringueiras |
60
|
4,680
|
720
|
540
|
5,346
|
120
|
0
|
3,120
|
| Theobroma |
300
|
2,200
|
2,000
|
750
|
2,200
|
196
|
1,933
|
1,611
|
| Urupa |
552
|
2,200
|
5,000
|
657
|
4,800
|
500
|
300
|
3,500
|
| Vale do Paraiso |
70
|
3,750
|
1,800
|
1,000
|
4,500
|
2,000
|
977
|
5,200
|
| Vila Nova do Mamore |
100
|
2,400
|
400
|
463
|
2,550
|
141
|
0
|
180
|
| Vilhena |
0
|
1,300
|
300
|
850
|
2,600
|
20
|
20
|
80
|
| Total |
25,042
|
157,300
|
166,063
|
38,915
|
211,524
|
30,917
|
36,776
|
134,829
|
Although production data are readily available, detailed information about the food market was difficult to obtain. Although ample data exist about the production of food in Rondônia, no data could be found to indicate the e xtent to which the expansion of agriculture in the region is driven by the demand for food in local urban centers. This question has occurred to government researchers in Rondônia, and a plausible methodology has been suggested, using data generated from road-side tax-collection stations along BR-364 (field notes, August 1, 1996). In theory, these data would provide a great deal of information about the food market in Rondônia, and indeed several informants indicated that such a study was alread y underway at EMBRAPA, a research center located between Porto Velho and Candeias. I telephoned and visited contacts at EMBRAPA, however, who informed me that the effort to quantify interstate food shipments had been abandoned as too difficult.
Food prices and dietary choice, however, do provide some clues. Beef is extremely inexpensive and popular, comprising a much more important part of the diet in the north than elsewhere in Brazil. Although a lot of the beef is consumed locally, it would not be accurate to say it is produced for local consumption. It is consumed locally precisely because so much beef is produced for other markets that the local price is especially attractive. Manioc is consumed extensively, and is strictly a regional food, so its production can be viewed as locally induced (field notes, June 21, 1996). Most packaged foods are expensive, and originate in Paraná or elsewhere in the South (field notes, July 8 and August 6, 1996). Even many local crops, such as rice, are trans ported to the South for packaging before they are sold in grocery stores in Rondônias cities, apparently because much of the commercial food business is dominated by businesses that have packaging operations located in the South. Almost everybody in Rondônias cities grows at least some food at home: virtually every house I visited or observed had at least one fruit tree. Farmers markets are an important source of food for some people in urban centers, however, indicating that at least some of the area devoted to fruits and vegetables in Rondônia is used to stock urban markets.
This led to the following hypothesis:
H0: Agricultural land in Rondônia is used to supply urban markets in the state, rather than export markets.
To test this hypothesis, the production of food crops is compared to population size. To reduce the effects of spatial scale on the analysis, the comparison is made both at the município scale (n = 40) and at the microregi on scale (n = 8). In each case, simple correlation is calculated between the area devoted to six basic food crops in 1994 and population size in 1995. At the município scale (n = 40), b = -0.7461, but r2 = 0.0439 (p = 0.1942). At the microregion scale, (n = 8), b = 0.0278, and r2 = 0.0169 (p = 0.7575). Thus, the null hypothesis is rejected, as no significant correlation between local markets and clearing for agric ulture is found. The implications of this finding are discussed in Chapter V below.
During the intensive phase of the research, it was determined that consumption of wood for housing should be investigated as a potential source of demand pressure on rain forest lands. For this reason, an evaluation of this demand relative to other sources of deman d was made. Forest products produced in Rondônia include Brazil nuts (Castanho do Pará), rubber, cut wood (lumber), charcoal, and fire wood. The annual production of Brazil nuts has experienced a secular decline since the early 1970s, while production of rubber has fluctuated within a relatively narrow range from year to year (Table 10). Reported production figures for cut wood, which according to Lisboa (1989) include only wood exported from the state of Rondônia, increased about 500-fold between 1972 and 1990. In comparison, the reported use of wood for charcoal is insignificant, while the use for firewood is almost half of that reported for cut wood.Table 10: Yield of Forest Products, Rondônia 1965 to 1990
| Year |
|
|
|
|
|
|
1965
|
824
|
5,997
|
|||
|
1966
|
1,025
|
3,295
|
|||
|
1967
|
1,587
|
4,000
|
|||
|
1968
|
3,313
|
4,965
|
|||
|
1969
|
2,412
|
4,824
|
|||
|
1970
|
3,230
|
4,357
|
|||
|
1971
|
3,357
|
4,336
|
|||
|
1972
|
4,480
|
5,706
|
3,822
|
||
|
1973
|
2,050
|
5,548
|
10,292
|
||
|
1974
|
1,725
|
4,227
|
18,451
|
||
|
1975
|
3,127
|
1,118
|
3 0,962
|
||
|
1976
|
3,247
|
2,415
|
44,897
|
||
|
1977
|
2,103
|
3,713
|
66,935
|
||
|
1978
|
1,503
|
1,903
|
101,676
|
||
|
1979
|
1,826
|
2,103
|
318,109
|
||
|
1980
|
1,201
|
2,016
|
307,001
|
||
|
1981
|
784
|
3,119
|
491,914
|
||
|
1982
|
833
|
4,177
|
581,372
|
||
|
1983
|
1,466
|
3,779
|
768,712
|
||
|
1984
|
1,392
|
4,018
|
1,256,307
|
||
|
1985
|
563
|
4,621
|
1,320,213
|
||
|
1986
|
|||||
|
1987
|
316
|
||||
|
1988
|
|||||
|
1989
|
907
|
4,629
|
2,255,352
|
963
|
967,667
|
|
19 90
|
1,472
|
6,105
|
1,903,646
|
867
|
809,340
|
De Bortollos (1996) account o f the development of Rondônias timber industry is instructive. Numerous, small sawmills (pica-pau) emerged around 1970 to serve the housing needs of new settlers in Rondônia (De Bortollo 1996). There was no tradition of export-oriented timber, and only a very small portion of the wood that was removed in the clearing of the land made its way to the timber mills. As the development projects grew during the middle 1970s, the fledgling timber industry drew some investment from the Center-So uth (e.g., São Paulo). These projects, intended to supply the local market, were not sufficiently successful to maintain a thriving timber industry. It was not until the late 1970s, when investors arrived who had a strong interest in harvesting wood for export to a national market, that the industry reached a significant size.
As noted in the field observations presented above, houses of recent construction in urban areas of Rondônia are typically constructed of wood (Photograph 7) or o f brick (Photograph 6). According to an interview with Solimar Bergamin, my contact in Rolim de Moura with timber-industry experience, a typical wood house measures four meters by five meters and requires about 70 planks, each measuring 2.5 meters by 30 centimeters by 2.5 centimeters, for a total volume of 1.3 cubic meters per house. A 2.5-meter section of a single large tree (Photograph 13) provides enough lumber for one such house. The construction of brick houses also results in the consumption of some w ood, because fire wood is used to fuel the brick ovens, which are common throughout the state.
Photograph
13: Timber for processing, Rolim de Moura
Photograph 14: Felled Trees Along BR-364, Jamari, Rondônia
< IMG SRC="Image15.gif" WIDTH=539 HEIGHT=315>
The question of whether local demand for timber is a significant factor in overall demand is posed in the form of the following hypothesis:
H0: The demand for timber in Rondônias urban places does not explain increases in timber harvests.
Table 11:
Timber for Housing, By Município
| Município |
|
|
|
|
|
|
| Ariquemes |
58.1
|
3.8
|
56%
|
10,445
|
39,437
|
485,204
|
| Cacoal |
53.7
|
3.5
|
64%
|
10,364
|
36,174
|
225,871
|
| Cerejeiras |
60.1
|
3.9
|
16%
|
3, 416
|
13,334
|
188,157
|
| Colorado do Oeste |
43.2
|
2.8
|
96%
|
3,500
|
9,830
|
160,098
|
| Costa Marques |
42.9
|
2.8
|
38%
|
1,381
|
3,852
|
223,291
|
| Espigao dOeste |
54.7
|
3.6
|
53%
|
2,585
|
9,188
|
133,527
|
| Guajara Mirim |
42.3
|
2.7
|
25%
|
6,073
|
16 ,689
|
126,002
|
| Jaru |
42.1
|
2.7
|
3%
|
6,250
|
17,115
|
340,121
|
| Ji Parana |
52.6
|
3.4
|
40%
|
17,574
|
60,062
|
179,514
|
| Ouro Preto do Oeste |
79.8
|
5.2
|
38%
|
5,357
|
27,778
|
328,436
|
| Pimenta Bueno |
51.7
|
3.4
|
61%
|
5,970
|
20,076
|
322,229
|
| Porto Velho |
38.2
|
2.5
|
20%
|
53,838
|
133,773
|
467,981
|
| Pres. Medici |
55.3
|
3.6
|
50%
|
2,521
|
9,060
|
219,808
|
| Rolim de Moura |
51.1
|
3.3
|
85%
|
6,645
|
22,086
|
274,350
|
| Vilhena |
54.0
|
3.5
|
50%
|
8,263
|
28,977
|
331,198
|
| Rondônia |
3.1
|
144,182
|
447,431
|
4,005,787
|
Documents made available by the state planning agency (SEPLAN, 1996) after the completion of my fieldwork confirms that small hydroelectricity plants are under a ctive consideration. The documents, intended to promote economic investment in Rondônia, were prepared at the micro-region level -- equivalent to the first seven municípios in the state -- but have been compiled into one document that outlines the prospects for investment throughout the state. As my contact in Rolim de Moura indicated (field notes, July 24, 1996), the unreliability of electricity is viewed as a major impediment to industrial development. For this reason, the discussion of each of the seven microregions includes a discussion of the availability of power and of future plans.
Although the documents are promotional in nature, they are circumspect in their treatment of the electric-power situation in the state. They cite interupted service in all of the microregions except Porto Velho, which is the location of the Samuel hydroelectric plant. In the other six microregions, private diesel-powered energy sources are used in about fifty percent of existing businesses. The discussi on of Ariquemes mentions its high-tension connection to the Samuel plant as a mitigating factor, but nonetheless describes the same service limitations described for most of the other microregions. The discussion of Ji-Paraná mentions the future power plant described by the engineer I interviewed at Samuel, and indicates that the new plant will have a capacity of 512 megawatts. Interestingly, the document does not provide a time horizon for that project, perhaps because it is as uncertain as my conta ct suggested it is.
The most interesting aspect of the discussion of electricity in these documents was the specific identification of sites for the small-scale hydroelectric projects that were mentioned by my contact at SEDAM (field notes, July 21, 1996). At the time of publication in 1996, only two such projects had been completed, but 43 more were planned (Table 12). Both of the completed projects are located in Rolim de Moura and together represent less than one percent of total planned capaci ty. Note that the aggregate potential of all of these plants would be less than half of the proposed plant in Ji-Paraná, and about equal to the capacity of the Samuel plant. The projects would be located throughout the state, in every microregion except Porto Velho, which has an adequate supply of electricity from the Samuel plant (Table 13). The result of these developments, if fully realized, would be the geographic dispersion throughout the state of the land-use impacts of further increases in hyd roelectric power generation.
| Status |
|
|
| Identified |
16
|
69,250
|
| Under Study |
9
|
33,750
|
| Under Construction |
18
|
109,920
|
| Completed |
2
|
1,750
|
| Total |
45
|
214,670
|
Table
13: Potential Micro-hydroelectric Plants, by Microregion
| Microregion |
|
|
| Ariquemes |
7
|
25,850
|
| Cacoal |
8
|
78,150
|
| Guajará-Mirim |
3
|
17,250
|
| Ji-Paraná |
6
|
20,610
|
| Rolim de Moura |
12
|
31,410
|
| Vilhena |
9
|
41,400
|
| Rondônia |
45
|
214,670
|
A relatively recent m asters thesis completed at UNIR addresses the question of economic diversification directly. Feitosa (1993) found a significant increase in the diversity of Rondônias economic activities during the period of rapid urban population growth. Between 1980 and 1989, for example, the number of industrial establishments in Rondônia increased by over six hundred percent (Feitosa 1993, 11). The major categories of industries operating in 1989 are shown in Table 14, which indicates the number of enterpr ises in each category and the number of municípios in which these enterprises could be found. Industries closely tied to resource extraction, such as timber and mineral processing, were most abundant in 1989, but a number of higher-order industries were also represented, such as clothing, food processing, and publishing.
Table
14: Industries Operating in Rondônia, 1989
| Type of Industry |
|
|
| Timber |
1,018
|
18
|
| Food products |
455
|
18
|
| Repair, Maintenance, and Conservation Services |
192
|
18
|
| Construction |
182
|
9
|
| Furniture |
132
|
18
|
| Non-metallic mineral production |
99
|
14
|
| Metallurgy |
88
|
11
|
| Publishing and Graphics |
51
|
13
|
| Mineral extraction and treatment |
40
|
4
|
| Clothing |
29
|
9
|
| Beverages |
6
|
5
|
| TOTAL |
2,292
|
18
|
Source: After Feitosa, 1993.
More specifically, diversification of Rondônias timber industry was evident during the 1980s (Feitsosa 1993). In addition to an increase in the number of sawmills between 1980 and 1989, a number of other processing facilities, such as plywood makers, emerged during the decade (Table 15). As of 1989, one-third of timber-processing businesses performed a value-added function beyond simple milling.
Table
15: Wood Processing Facilities, Rondônia, 1980 and 1989
|
|
|
|
|
||||||
| Município |
|
|
|
|
|
1989
|
|
|
|
|
|
12
|
17
|
3
|
38
|
15
|
55
|
20%
|
69%
|
|
|
|
2
|
4
|
1
|
6
|
3
|
10
|
33%
|
60%
|
|
|
|
12
|
38
|
19
|
12
|
57
|
33%
|
|||
|
|
49
|
159
|
4
|
27
|
53
|
186
|
8%
|
15%
|
|
|
|
11
|
35
|
32
|
11
|
67
|
48%
|
|||
|
|
18
|
49
|
2
|
21
|
20
|
70
|
10%
|
30%
|
|
|
|
20
|
52
|
5
|
46
|
25
|
98
|
20%
|
47%
|
|
|
|
8
|
46
|
3
|
30
|
11
|
76
|
27%
|
39%
|
|
|
|
64
|
46
|
2
|
26
|
66
|
72
|
3%
|
36%
|
|
|
|
18
|
53
|
34
|
18
|
87
|
39%
|
|||
|
|
8
|
34
|
4
|
21
|
12
|
55
|
33%
|
38%
|
|
|
|
22
|
43
|
21
|
22
|
64
|
33%
|
|||
|
|
39
|
17
|
56
|
30%
|
|||||
|
|
45
|
10
|
55
|
18%
|
|||||
|
|
66
|
19
|
85
|
22%
|
|||||
|
|
18
|
1
|
19
|
5%
|
|||||
|
|
32
|
2
|
34
|
6%
|
|||||
|
|
5
|
5
|
|||||||
|
|
244
|
781
|
292
|
1,521
|
268
|
1,151
|
9%
|
32%
|
|
Source: After Feitosa 1 993.
Building on Feitosas work, I have endeavored to test the following hypothesis:
The 1996 classified telephone listings ("Yellow Pages") for Rondônia (Teleron 1996), were obtained in the field. The listings are identical in form to classified listings found in classified telephone directories in the United States. They have limitations as a data source (some businesses do not have telephones, for example, while others may be listed in multiple ca tegories), but the listings provide far more detail than any available commercial or industrial census. They include listings for several thousand businesses in 1,040 categories. Listings are statewide, including 27 of Rondônias 52 município seats. Of these, 380 could be identified as non-government, service-sector categories, and are used in the analysis.
A matrix of urban places and business categories was created, with a binary code representing the presence or absence of a given bu siness type in each place. The number of service-sector categories present in each settlement is counted, and each city is assigned to classes based on the number of enterprise types found in it. The classes are tested against four indicators of a central-place heirarcy identified by Hochberg and Miller (1992, after Marshall 1989). Centrality, as used here, refers to the number of kinds of services represented in a given city. The indicators are:
Table 16:
Munic&iacut e;pios by Service-sector Class
| City |
Count
|
|
| Porto Velho |
323
|
|
| Ji-Parana |
158
|
|
| Vilhena |
112
|
|
| Cacoal |
100
|
|
| Ariquemes |
91
|
|
| Pimenta Bueno |
69
|
|
| Rolim de Moura |
55
|
|
| Ouro Preto do Oeste |
47
|
|
| Guajara-Mirim |
42
|
|
| Jaru |
42
|
|
| Colorado do Oeste |
27
|
|
| Espigao do Oeste |
26
|
|
| Cerejeiras |
19
|
|
| Presidente Medici |
19
|
|
| Alta Floresta do Oeste |
13
|
|
| Urupa |
11
|
|
| Alvorada do Oeste |
8
|
|
| Machadinho |
5
|
|
| Nova Brasilandia do Oeste |
5
|
|
| Costa Marques |
3
|
|
| Jamari |
3
|
|
| Nova Mamore |
3
|
|
| Santa Luzia do Oeste |
3
|
|
| Mirante da Serra |
2
|
IV
|
| Monte Negro |
2
|
|
| Cabixi |
1
|
|
| Ministro Andreazza |
1
|
|
Table 17:
Characteristics of Service Classes
| Class |
I
|
II
|
III
|
IV
|
|
|
0
|
89
|
29
|
18
|
|
|
&nb sp; |
165
|
14
|
7
|
|
|
1
|
5
|
6
|
15
|
|
|
323
|
223
|
107
|
40
|
|
|
1.45
|
2.08
|
2.68
|
|
|
|
138
|
91
|
51
|
|
|
|
43%
|
41%
|
48%
|
Figure 8: Service Center Classes
Note: o = urban place not includ ed in database
Figure 9: Municípios of Rondônia
![]()
The government of Rondônia has more specific economic plans related to the shift in emphasis from rural to urban populations and economies. Two documents obtained during fieldwork describe government plans: a four-year plan of economic goals for the period 1995 to 1998 (SEPLAN 1995) and a document encouraging private investment in Rondônia (SEPLAN 1996). The four-year plan, recognizing the presence of a labor surplus in Rondônias cities -- and the limitations of an economy based on primary-sector activities -- proposes a new generation of "development poles" in existing urban centers. The purpose of financial incentives and infrastructure investment in these poles will be to build upon the existing extractive industries to create employment in secondary and tertiary activities (SEPLAN 1995, 114). Most of the site-specific plans (Table 18) are in secondary-sector activities based on local raw materials. Notable exceptions include plans for the expansion of gr anite mining in Jaru, a computer-hardware industry in the border zone at Guajará-Mirim, and eco-tourism based in the border zone at Costa Marques.
Table 18:
Urban Growth Poles - Planned Activities
| Município | Proposed Activity(ies) |
| Vilhena | Soy processing, including animal feed |
| Cacoal | Cotton processing, including animal feed from residue |
| Pimenta Bueno | (Finished) clothing industry
Ceramic and limestone industries |
| Rolim de Moura | Citrus fruit and juice processing |
| Ji-Paraná | Fish packing (based on aquaculture in Ariquemes and Cacoal) |
| Ouro Preto do Oeste | Furniture industries
Coffee processing, including instant coffee |
| Jaru | Granite mining and processing of granite for
façades and paving stones
Leather processing and shoe production |
| Ariquemes | Tin smelting and artisan industries using semi-precious stones |
| Porto Velho | Processing of manioc and fruit pulps
Furniture industries Fish packing (based on aquaculture in Guajará-Mirim, Nova Mamoré, Porto Velho, Candeias do Jamari, and Jamari) |
| Guajará-Mirim | Computer hardware and peripherals |
| Colorado do Oeste | Fish packing (based on aquaculture in Vilhena, Cerejeiras, and Pimenteiras) |
| Costa Marques | Eco-tourism
Processing of vegetable products (Brazil nuts, rubber, medicinal extracts, and cosmetics) |
Source: SEPLAN 1995, 122.
Consistent with the four-year plan, the state planning agency is actively seeking private investment for a variety of economic activities located in specific microregions of Rondônia, as shown on Table 19. For some activities, it is suggested that outside support would be needed, but in many cases state an d municipal governments are providing infrastructure and even buildings for projects of this kind. In Ariquemes, for example, several million dollars (U.S. equivalent) are proposed to fund a business incubation center for the wood-processing sector, particularly furniture making. According to Feitosa (1993, cited above), Ariquemes had more sawmills than any other city as of 1989. Although it also had more value-added wood-processing facitilies than most cities, the potentially redundant labor force (following a decline in forestry) is large, and both state and municipal planners are eager to encourage businesses that will absorb some of this labor.
Table 19:
Potential Activities by Microregion, 1996
| Activity | Vilhena | Cacoal | Ariquemes | Guajara Mirim | Porto Velho | Ji- Parana | Rolim de Moura |
| Dairy processing |
X
|
X
|
X
|
X
|
X
|
X
|
X
|
| Fruit juice and pulp processing |
X
|
X
|
X
|
X
|
X
|
X
|
|
| Furniture |
X
|
X
|
X
|
X
|
X
|
X
|
|
| Cattle raising |
X
|
X
|
X
|
X
|
|||
| Coffee |
X
|
X
|
X
|
X
|
|||
| Cold storage |
X
|
X
|
X
|
X
|
|||
| Food processing |
X
|
X
|
X
|
X
|
|||
| Tanning |
X
|
X
|
X
|
X
|
|||
| Wood |
X
|
X
|
X
|
X
|
|||
| Non-me talic mineral products |
X
|
X
|
X
|
||||
| Agroforestry management |
X
|
X
|
|||||
| Cacao |
X
|
X
|
|||||
| Cotton processing |
X
|
X
|
|||||
| Fruit cultivation |
X
|
X
|
|||||
| Manioc products |
X
|
X
|
|||||
| Metallic minerals |
X
|
X
|
|||||
| Animal feed |
X
|
||||||
| Coffee - instant |
X
|
||||||
| Cold storage - fish |
X
|
||||||
| Cold storage - meat |
X
|
||||||
| Ecotourism |
X
|
||||||
| Fish |
X
|
||||||
| Fish culture |
X
|
||||||
| Rubber processing |
X
|
||||||
| Tropical fruit processing |
X
|
||||||
| Wood lamination |
X
|
Source: SEPLAN 1996.
|
by James Kezar IV Hayes-Bohanan, Ph.D. |
||||
|
|
|
|
|
|
|
|
Back to Rondônia Web |
|
||