Due: Oct 20th at 11:59pm
In this project you will open a window, and display some data using arcade and the rest of the python you have learned.
caveat: if you had 6 months of
python experience, then you would use other fancier libraries to do this
sort of visualization. But since we do not, we'll use what we have.
For this project,
Traditionally a housing market is affordable if the median house
        price is less than or equal to 3 times the median household income.
We will define marginally affordable as not affordable, but the
        median house price is not more than 4 times median household income.
not affordable will be everything else.
| First name Starts with | States |
| A and B |
["Massachusetts", "Connecticut", "Rhode Island","North Dakota", "Iowa"] |
| C and D |
["Iowa","Washington", "New Jersey", "Illinois", "Missouri"] |
| E through G |
["Oklahoma", "Georgia", "Texas", "Ohio", "Pennsylvania"] |
| H through J |
["New York", "Michigan", "South Dakota", "Virginia", "Iowa"] |
| K through M |
["Kentucky", "Kansas","North Carolina", "Alabama", "Ohio"] |
| N through R |
["West Virginia", "Ohio", "Indiana", "Maine", "Vermont"] |
| S through the end of alphabet |
["Minnesota", "Alaska", "Oregon", "Wisconsin", "Ohio"] |
| Prof Santore |
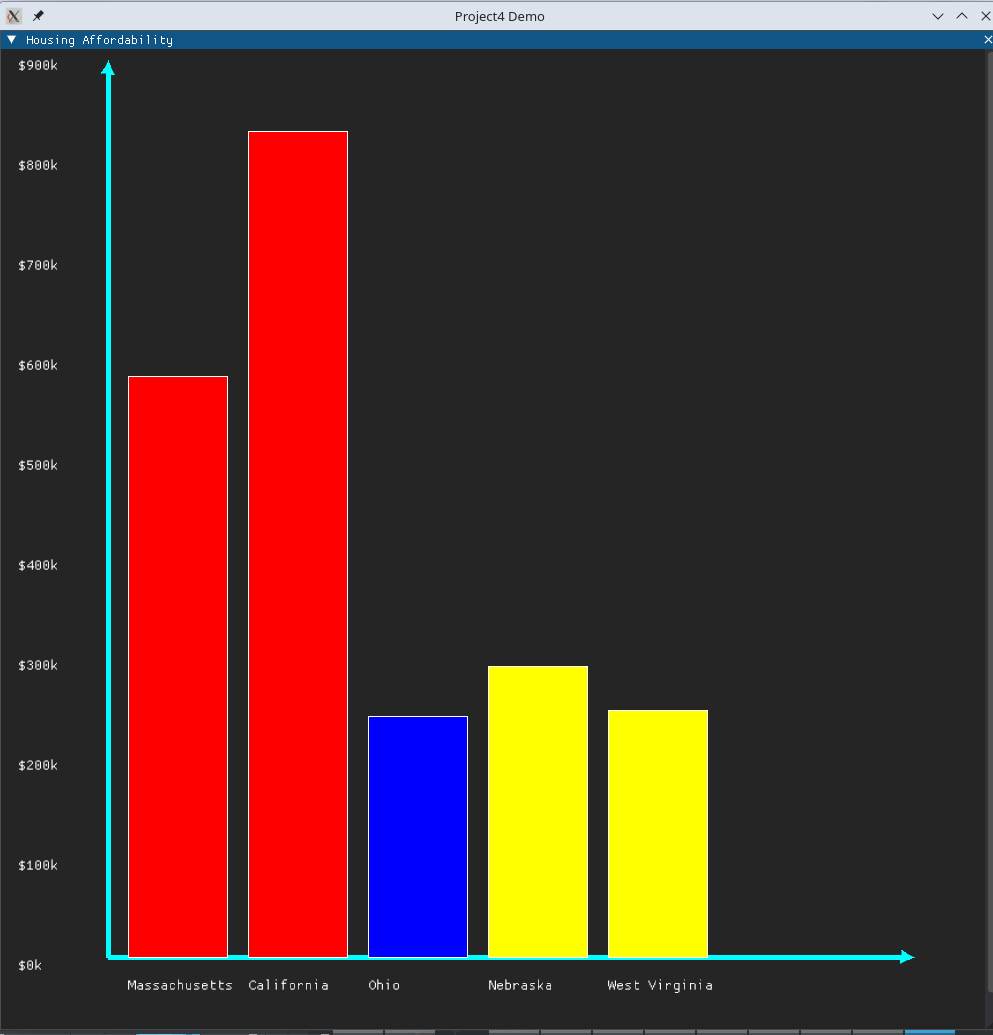
["California", "Nebraska", "Massachusetts", "West Virginia", "Ohio"] |
You can see an image of my solution to this project below
Of course put this into git and onto github sooner rather than later.
Additional requirements:
Your code must be commented. you don't have to comment every line, but you
need to explain to me what you are doing in the code.
As with the previous project, to submit the project to me, share it with me on github. My github id is jsantore. You can see directions for doing this here.