Wireshark Tutorial
INTRODUCTION
The purpose of this document is to introduce the packet sniffer WIRESHARK.
WIRESHARK would be used for the lab experiments. This document introduces the
basic operation of WIRESHARK.
PACKER SNIFFER:
The basic tool for observing the messages exchanged between executing protocol entities
is called a
packet sniffer. As the name suggests, a packet sniffer captures (“sniffs”)messages being sent/received from/by your computer; it will also typically store and/or
display the contents of the various protocol fields in these captured messages. A packet
sniffer itself is passive. It observes messages being sent and received by applications and
protocols running on your computer, but never sends packets itself. Similarly, received
packets are never explicitly addressed to the packet sniffer. Instead, a packet sniffer
receives a
copy of packets that are sent / received from/by application and protocolsexecuting on your machine.
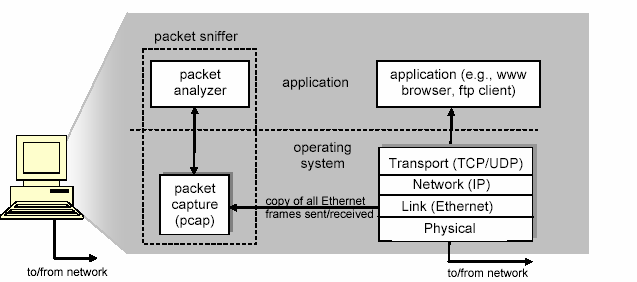
Figure 1 shows the structure of a packet sniffer. At the right of Figure 1 are the protocols
(in this case, Internet protocols) and applications (such as a web browser or ftp client)
that normally run on your computer. The packet sniffer, shown within the dashed
rectangle in Figure 1 is an addition to the usual software in your computer, and consists
of two parts. The
packet capture library receives a copy of every link-layer frame thatis sent from or received by your computer. Messages exchanged by higher layer protocols
such as HTTP, FTP, TCP, UDP, DNS, or IP all are eventually encapsulated in link-layer
frames that are transmitted over physical media such as an Ethernet cable. In Figure 1,
the assumed physical media is an Ethernet, and so all upper layer protocols are eventually
encapsulated within an Ethernet frame. Capturing all link-layer frames thus gives you all
messages sent/received from/by all protocols and applications executing in your
computer.
The second component of a packet sniffer is the
packet analyzer, which displays thecontents of all fields within a protocol message. In order to do so, the packet analyzer
must “understand” the structure of all messages exchanged by protocols. For example,
suppose we are interested in displaying the various fields in messages exchanged by the
HTTP protocol in Figure 1. The packet analyzer understands the format of Ethernet
frames, and so can identify the IP datagram within an Ethernet frame. It also understands
the IP datagram format, so that it can extract the TCP segment within the IP datagram.
Finally, it understands the TCP segment structure, so it can extract the HTTP message
contained in the TCP segment. Finally, it understands the HTTP protocol and so, for
example, knows that the first bytes of an HTTP message will contain the string “GET,”
“POST,” or “HEAD”.

Figure 1:
Packet sniffer structureRunning Wireshark
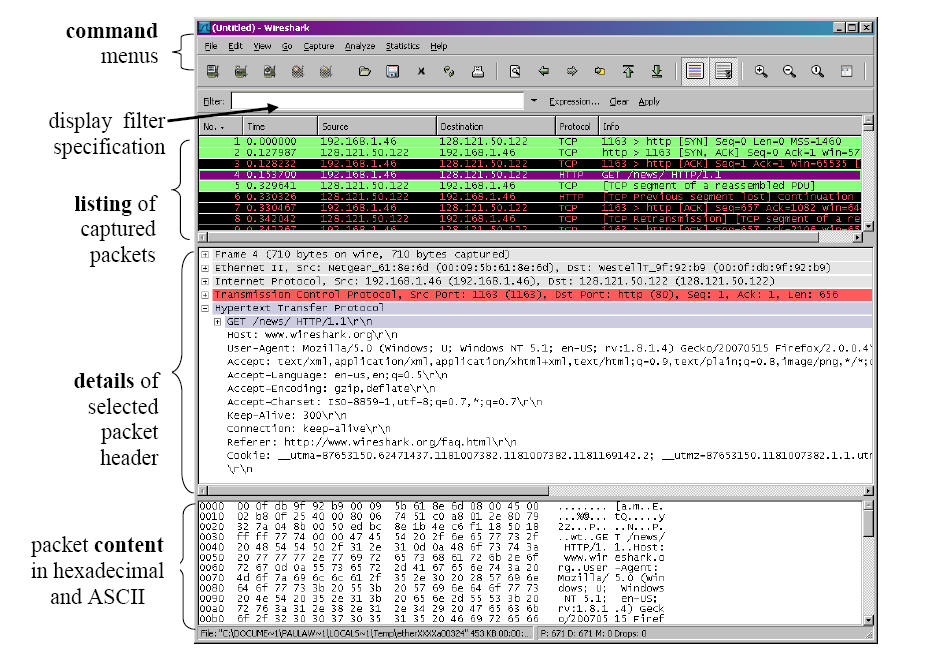
When you run the Wireshark program, the Wireshark graphical user
interface shown in
Figure 2 will de displayed. Take a look at the row of icons under the menu
toolbar.
The second icon from the left is the icon you want to click to set up a capture.
Figure 2: Wireshark Network Analyzer Window
Clicking on this button open up the Capture Options window shown in Figure 3. In
the Capture Options
window you must configure, at minimum, an interface which to use for the
capture. All available
interfaces will be listed in the Interface dropdown.
From the menu bar select Capture then select Options
You will be greeted by the Capture Options window as shown below:
Figure 3: Capture Options Window
In this window you will find everything you need to start a capture.
Interface : The Interface drop-down list allows you to choose
the inerface for which you want packet
trace taken. For example, if your machine has both an Ethernet interface and a
wireless
interface, you must choose which interface to monitor. If you choose the
Ethernet
interface, only traffic sent over the wired connection will be recorded. If you
start a
capture and see no traffic then you may need to choose a different network
interface.
Click on Start button and you will see the window below:

Exit Wireshark.