In this second project you will open a file, and create a very simple visualization, practicing, random, slices and more.
Friday
Feb 25th at 11:59pm.
As per our in class discussion on Feb 23rd, Since BSU is closed on Friday Feb 25th, I am pushing the due date to Mon Feb 28th at 5pm. That way students can see me in my Monday office hours and See Tyler in the Monday PAL session.
The one downside is you will need to
begin reviewing for the midterm while still working on this project
First create a new project (which creates a new project folder) – use the naming convention from the “Additional Requirements” section below.
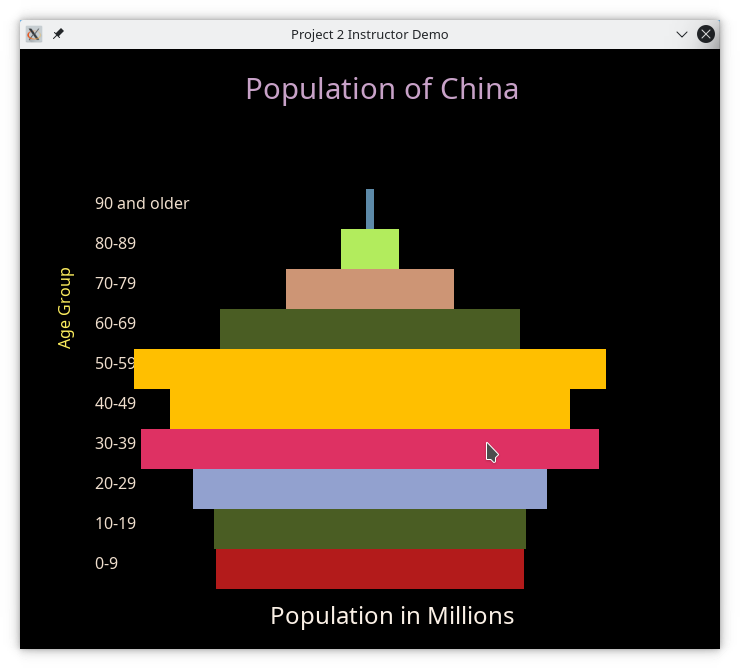
graph label: size
When I ran my solution on the Sample Data File 1, I had this output. I used twice the value from the data line in the file (so for example I read in 200 in the 40-49 age line and multiplied it by 2, so I ended up drawing a 400 pixel wide rectangle.
Your code must be commented
Your function must contain all of your code except the one line invoking
the function
To help me identify your work, make the name of your project
yourFirstInitialLastNameProject2
(so mine would be JSantoreProject2)
And put the following at the beginning of the program as a comment:
Your name
anything that was left undone
anything that I need to know to run the program correctly.
Submit the project by putting it on github as a private project and making me a collaborator as before.
References:
I got the data in the two data files from https://www.census.gov/data-tools/demo/idb/#/pop?COUNTRY_YEAR=2022&COUNTRY_YR_ANIM=2020&FIPS_SINGLE=CH&FIPS=US&popPages=BYAGE&POP_YEARS=2022&menu=popViz&ageGroup=5Y