Comp 151 Project 4
Display some Data from a file
Summary:
In this 4th project you will open a file, and create a very simple
visualization, practicing arcade, files, lists, if statements and
loops.
Due:
Oct 21, 2022 at 11:59pm
Description:
First create a new project (which creates a new project folder) – use the
naming convention from the “Additional Requirements” section below.
(include your name and something identifying this as project4)
- Download the file nationsPop.txt into your
project
- open the file and read all of the lines into a list of lines The file
is a comma separated list
- each line is in the format
country name,country pop,percentage change
eg:
Nigeria,218541212,2.41
Means that Nigeria has a population of 219 hundred million people and
a growth rate in the last year of 2.41%
- Open an arcade window, and show it on the screen (the whole run,
strart_render etc)
- Draw the Title of the graph
- draw the x-axis
- label the x-axis (see below in item 7, if the nation titles don't
line up perfectly that is ok)
- draw the y-axis
- label it
- For each line in the file.
- split the line on the comma
- you will draw a bar representing the population of this country for
each line in the file
- if the percentage change is negative draw the bar in one color
- in the percentage change is positive draw the bar in another
color.
- draw the country name in the correct spot below the x-axis
- draw the bar the correct height and color over the county name
- if you make your graph look like mine, I found the bar height
using this math:
-
bar_height = (int(nation_data[1])-100_000_000)/1_000_000
- where nation_data was my split line. I remove 100 million because
that is the bottom value in the graph, then I divide the rest by one
million so that I keep the population value usable.
- I will try your solution with both the
2022 data that I gave to you here and with the 2021 data to make sure
that your program is working from the file and not just drawing a
picture.
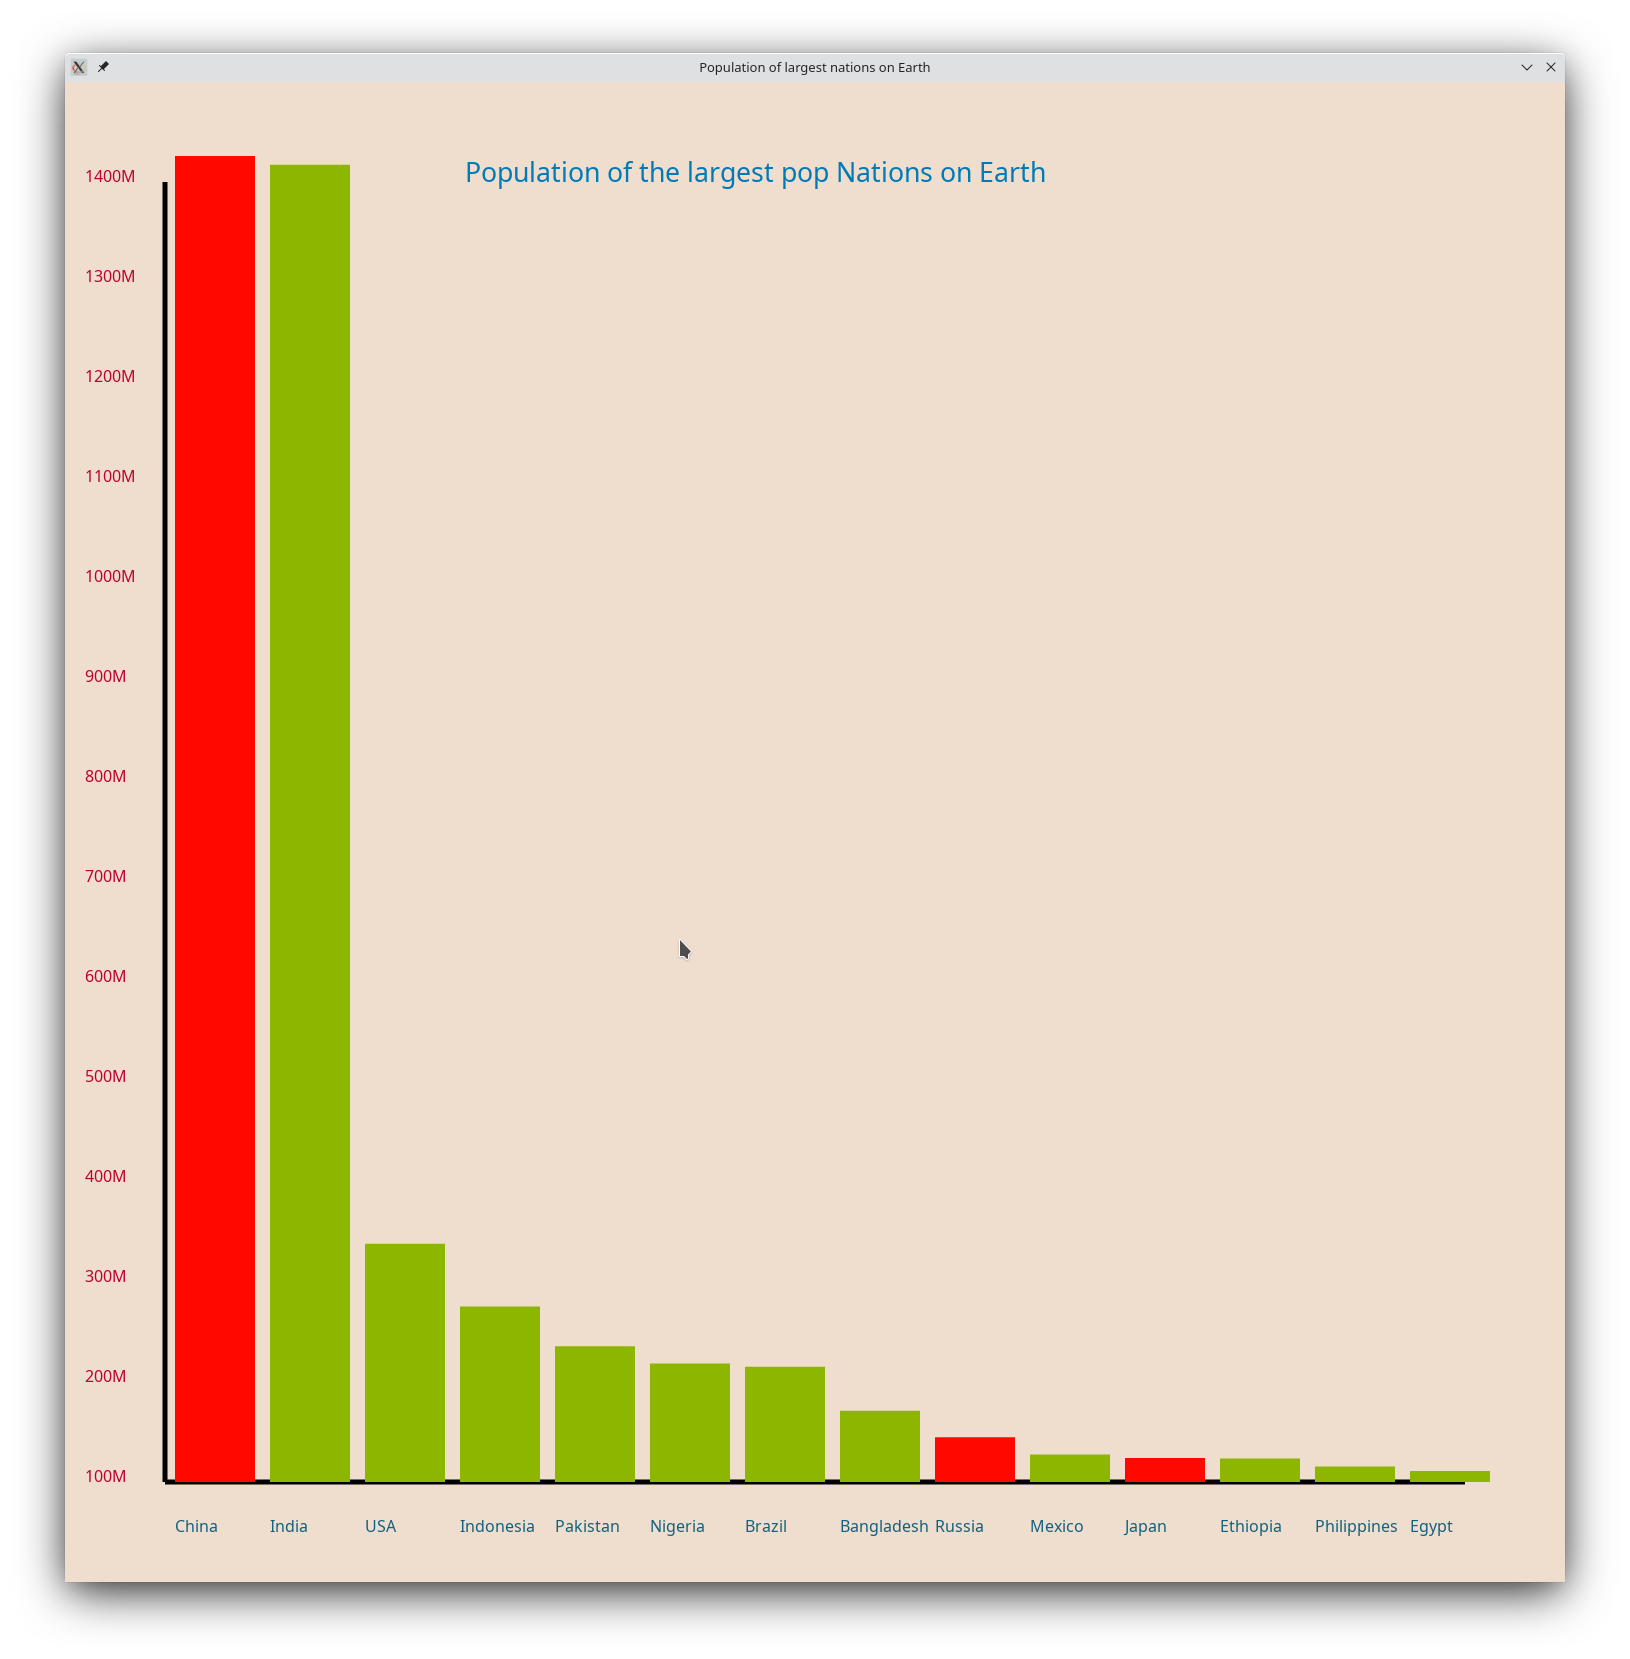
Sample output.
When I ran my solution on the provided
nationsPop.txt File, I had this output.
Additional requirements:
Your code must be commented
To help me identify your work, make the name of your project
yourFirstInitialLastNameProject4
(so mine would be JSantoreProject4)
And put the following at the beginning of
the program as a comment:
Project Submission
Submit the project by putting it on github as a private project and
making me a collaborator as before.